Utilizing advanced cloud native tools without the ability to effectively unify, track, and display current conditions can create significant gaps in your security coverage. By ensuring complete visibility into your security posture across your environment, you can quickly identify key issues and prioritize them for resolution. Our latest installment of Aqua Enterprise includes a unified dashboard that operationalizes security coverage through access to more immediate, contextual, and actionable information.
We listened to our customers, and in true DevOps style, they told us they want to close security loops faster and in shorter cycles. This is why they want a detailed, customizable dashboard within Aqua — something in addition to SIEM and other integrations that provide aggregate views.
Complete visibility into your cloud native security
Although our Aqua cloud native security dashboard includes customization so you can build exactly what you need, our dashboard also provides easy to understand trends right out of the box:
- View the overall risk assessment of assets (as calculated by Aqua) – understand the risk level of your organization’s images, containers, serverless functions, and hosts.
- Assess compliance for all assets – perform checks against organizational security policies to easily determine the percentage of non-compliant assets.
- Trace Runtime Events over select periods (e.g., seven days, 30 days) – keep close track of what happens in your environment.
- Track most-violated policies – identify assurance policy failures and runtime policy violations.
These metrics allow C-level managers, Security officers, and DevSecOps engineers to quickly gain visibility and understanding into their cloud native environment to locate where the real issues are and quickly remediate.
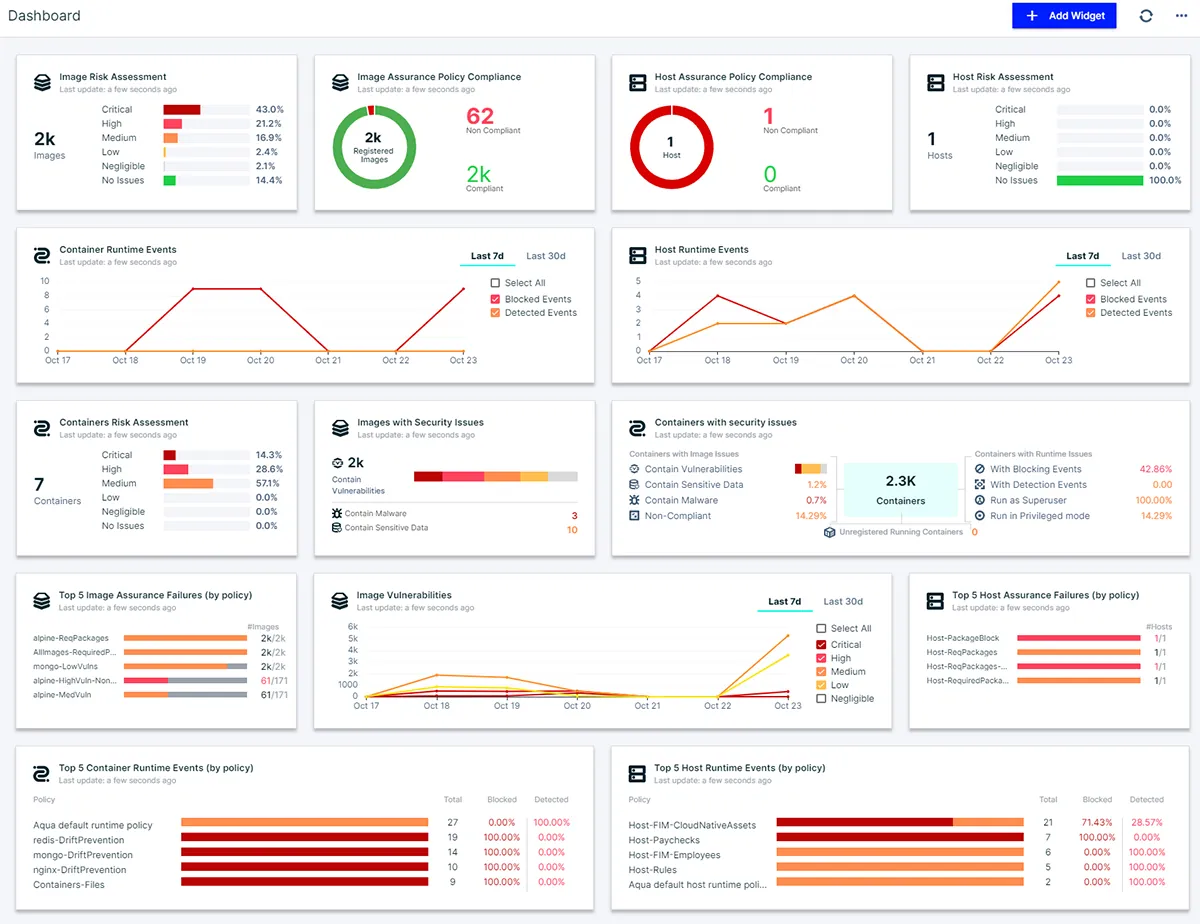
Aqua Security customizable dashboard
The case for a dedicated security dashboard
If you’re asking yourself, “but I still don’t understand why I need another dashboard in addition to SIEM?” Well, while all enterprises use SIEM and other monitoring solutions for security data and events, which we happily integrate with, our customers have been telling us they need more immediate, contextual, and actionable information.
Using just SIEM, if you have an issue with a specific container, you must find a way to feed that information to the appropriate person — and doing this in a timely manner is not easy. SIEM systems collect and aggregate data to produce a higher-level view, but they often lack the controls needed to focus on a specific area that should be managed by specific individuals.
Another advantage of a dedicated dashboard is that it can be tailored to present a higher level of management information. As cloud native technologies are rapidly and dynamically deployed, a dedicated, configurable dashboard is the only way to keep pace.
Control what you see, manage what you own
Different teams in your organization are probably only permitted to view specified parts of your overall environment. This creates a critical need for a dashboard that can segregate the display of information, especially on shared pages. To accomplish this, our dashboard fully supports Aqua’s multi-application role-based access control (RBAC). The same logic used to assign (or restrict) access to different groups and individuals also applies to the dashboard. Users from different teams, as your access controls dictate, could see different data under any shared security widgets:
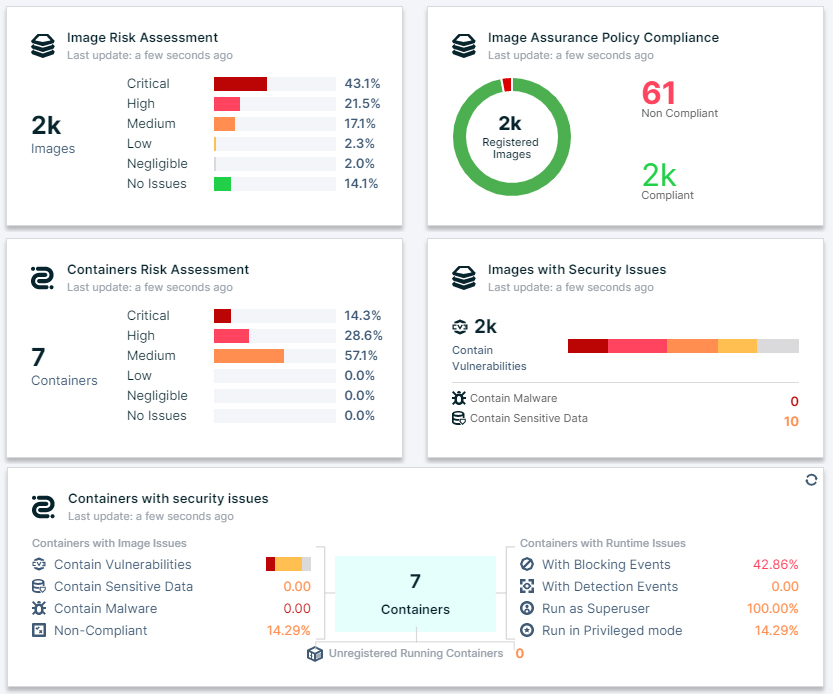
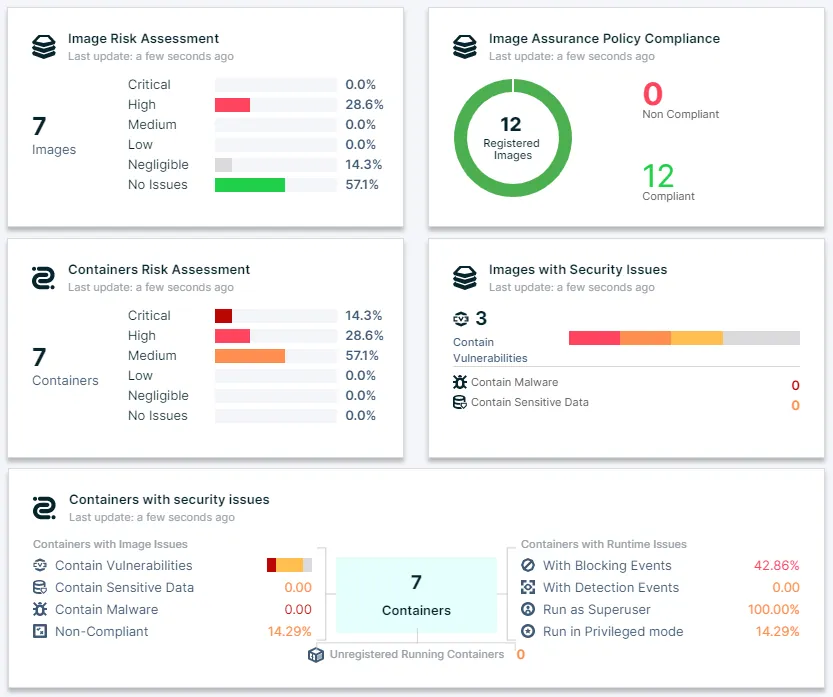
Filtered view by role/team
Some users, like team leaders, group leaders, and other managers, may need access to information for more than one application. In this case, it’s possible to assign them access to each relevant application, providing a consolidated, higher-level view across those applications.
Also in our new cloud native security dashboard, users responsible for several application scopes can choose exactly what they would like to see by selecting the desired scope on the dashboard page:
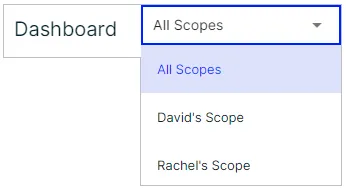
Dashboard scope control
Dashboard customization
While Aqua’s dashboard comes ready-made with the features most users want, some users might want to focus their dashboard on more specific needs. For example, a DevOps engineer might prefer to monitor and manage information that evolves around only the application build artifacts. Since security findings for the infrastructure or the workloads may be less relevant to DevOps engineers, this reduces receiving irrelevant information.
Customizing your own dashboard is easy. Aqua offers a rich library of ready-made dashboard widgets:
- Organizational compliance status
- Asset risk assessment
- Asset security issues
- Vulnerability detection over time
- Violated security policies
- Detected and Blocked runtime events over time
The following security widgets can be employed to build your own customized cloud native security dashboard:
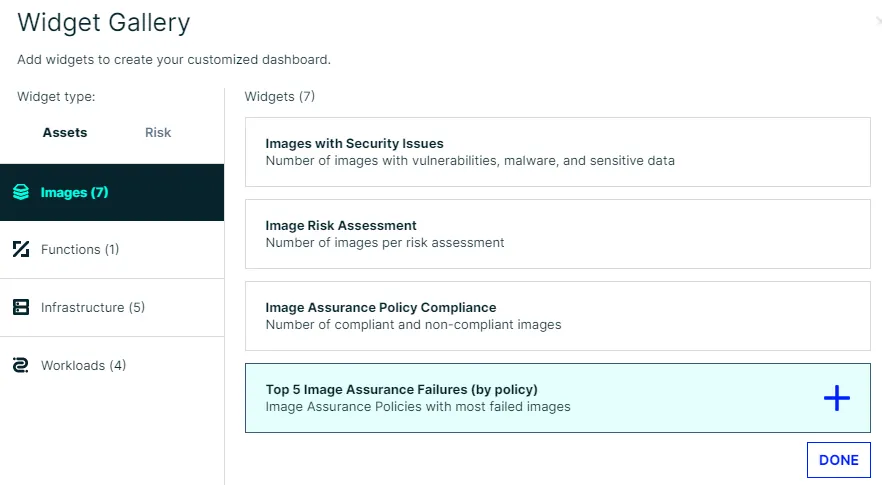
Widget gallery of customized dashboards
Users can choose widgets from the widget gallery and place them in the desired spot on their customized dashboard to create an effective layout for their needs:
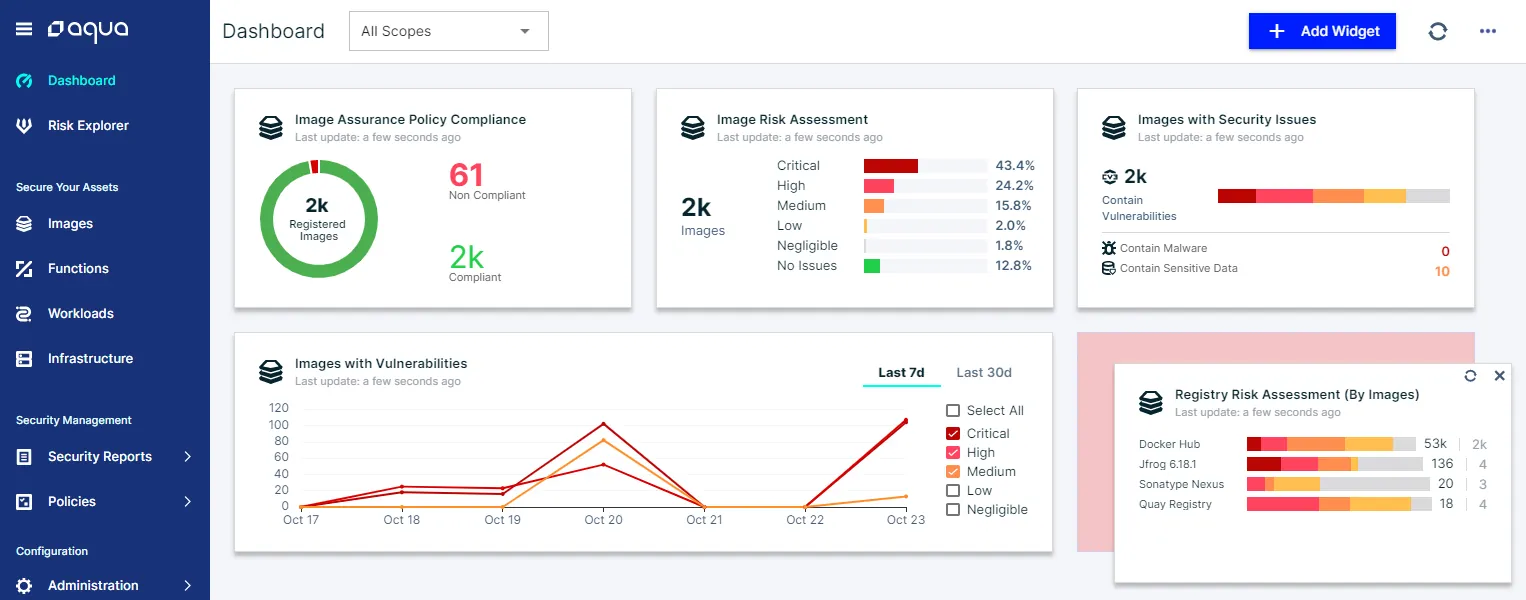
Customized drag-and-drop dashboard
Stay focused on what’s most important
Our new cloud native security dashboard provides a complete view of your cloud native security posture. It allows different users with different application scopes to view data that is most relevant to them — enabling them to focus on what’s most important by knowing where the security issues are and the cause. Monitoring real-time events and understanding exactly when a malicious activity has taken place allows you to better understand and control the risks affecting your environment.
