We have some exciting news about two new features in Tracee, Aqua’s open source container and system tracing utility. Now, Tracee is much more than just a system call tracer, it’s a powerful tool that can be used to perform forensic investigations and dynamic analysis of binaries – both are incredibly useful when looking for hidden malware. Tracee can provide users with timely insights that previously required special knowledge and tools.
- Capture any file write in the system and to save the data to a given output path. However, Captured files are not limited to files that are saved to disk, and pseudo file systems writes can be captured as well. A special case demonstrated below shows how Tracee can capture files executed from memory using memfd_create() and execveat() system calls (aka “fileless” execution) using this feature.
- Capture dynamic code execution, meaning code that is loaded during runtime by a process and then executed. We demonstrate below how Tracee captures such a payload, which was obfuscated by a packer, and then found to be malicious by an AV program. The same AV was unable to detect the malicious payload in the original file.
Using these features, we can now automatically uncover stealthy payload executions of malware, and quickly gain insights into a process. Otherwise, extracting these payloads is not always an easy task, and may require a memory dump after the malware unpacked its payload (when a packer is used) or after the creation of the fileless executable in memory (when memfd_create + execveat is used). Moreover, attackers might use anti-analysis methods and obfuscation techniques that make this task even harder. Below are demos of the new Tracee features:
Demo of capturing files executed from memory (fileless)
Demo of a packed payload capture
Other than the above use cases, capturing file writes has many other uses. For example, you can use it to capture writes into /dev/null, which an attacker could use to hide his traces. Socket writes can also be captured (when filtering by UNIX or TCP), and even a (very) simple backup service of a given directory. One point to note here is that the files are copied as they are being written to the vfs layer. This means that no inotify (Linux kernel subsystem) or polling mechanism is used.
Capturing files executed from memory
Previously, we tried to find a way to capture files being executed from process memory to further analyze them. However, since these types of files do not exist in the filesystem (from the user point of view), and are only in the memory of the executing process, this is difficult to do. One option was to use ptrace (commonly used by debuggers, e.g., gdb), looking for memfd_create() and execve()/execveat() system calls, and then poking the process memory to extract the relevant data. But things tend to get ugly fast when using ptrace, and malware can easily evade it by using anti-debugging techniques (for a good reference about the subject, see “Programming Linux Anti-Reversing Techniques” by Jacob Baines). Apart from the problem of extracting the data from the process memory, we needed a method to filter out all executions that are not made from memory, and keep only those that we are interested in.
Transferring big amounts of data
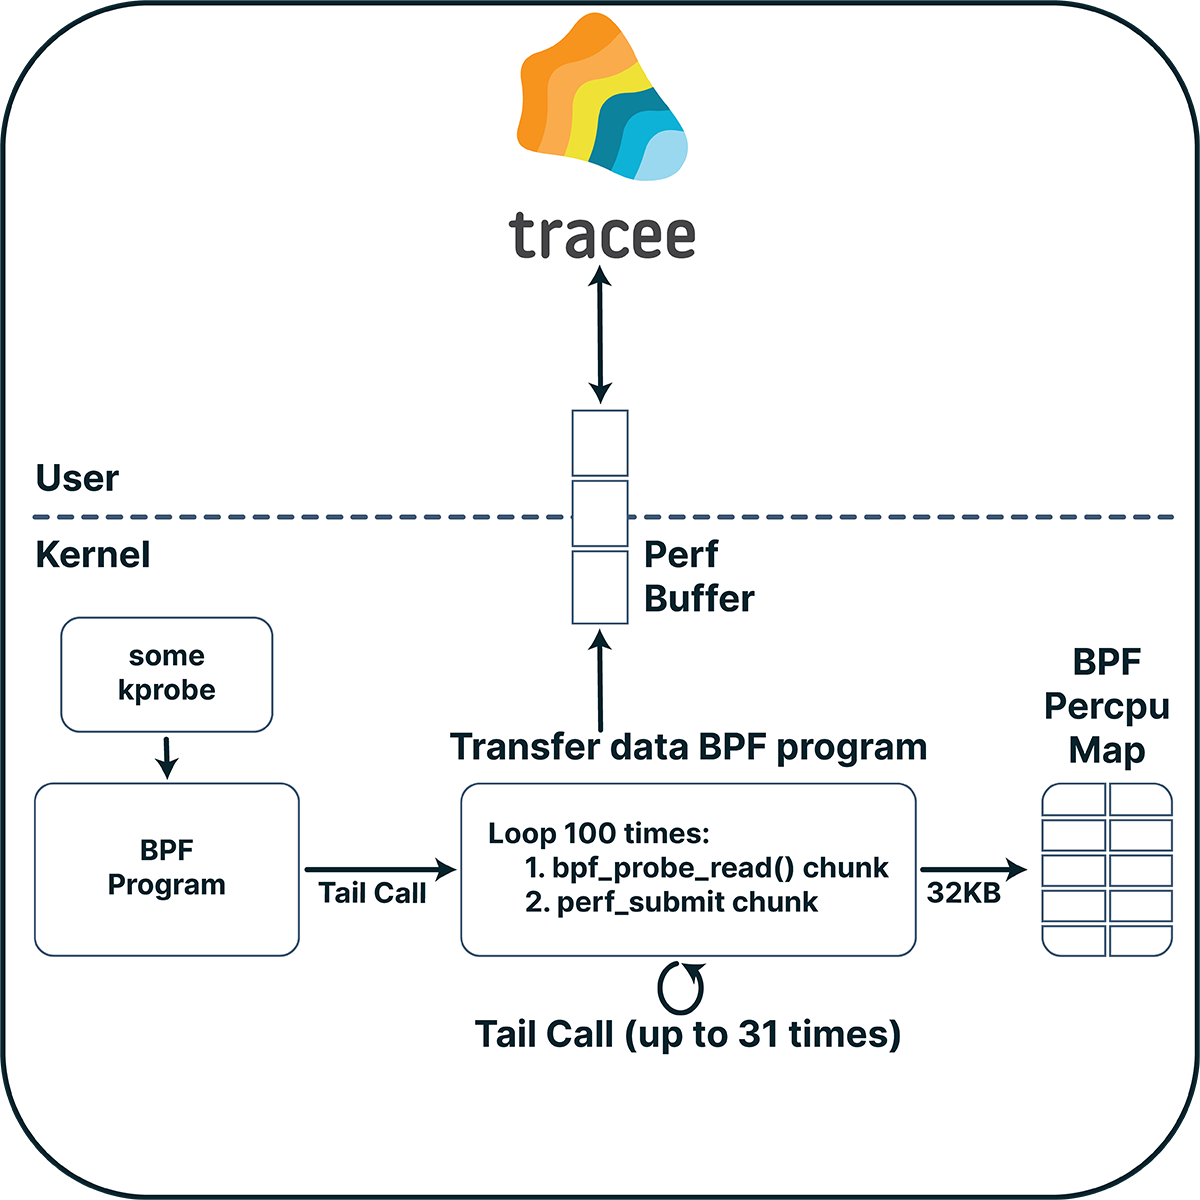
The first challenge was how can we send a big chunk of data (given a pointer to that data) from our BPF program (which runs in the kernel BPF VM) to our user space program. We could have done this using a bpf map, but we need to remember that multiple CPUs can access the same map at the same time, so the map must be a per-CPU map. However, there are two problems when using this type of map for this kind of communication. The first is that a per-CPU map element is limited to 32KB due to limits defined in the kernel (in linux/mm/percpu.c). The second problem is that we will not be able to write on the map again until our userspace program reads the data out of it. If we want to transfer multiple data chunks of different events, we might lose some of these chunks, as data can be overwritten due to race conditions.
Another approach would be to submit the data with a perf buffer. But to do that, we need to use a percpu map (again) where we can save the data before we submit it. To overcome the 32KB limit, we can send the data in smaller chunks using a loop. But BPF doesn’t allow loops, right? That’s true, but we can use loop unrolling (where the compiler rewrites the loop as a repeated sequence of similar blocks of code) to loop up to a constant number. This constant number can’t be too big, since BPF (up to kernel 5.2) limits the number of instructions in a program up to 4096 instructions, which reduces the maximum number of iterations to about 100 iterations.
Using this method, we can transfer approximately 3MB to user space. Can we do any better? Tail calls to the rescue. BPF programs can call other BPF programs using a tail call mechanism. Using this mechanism, we can call a program that will send small chunks in a loop and will recursively call itself to send the rest of the data. The maximum number of tail calls is limited to 32, which gives ~100MB that we can now transfer from our BPF program to user space. That should be enough for our uses.

Figure 1: Transferring big amounts of data
Capturing file writes
Now that we have a mechanism to transfer big chunks of data, we need to find a way to capture the files we want. Specifically, we wanted to capture binaries that were executed from memory. Too bad for us, BPF can’t interact directly with the filesystem (e.g., read a file), so we have to do this in two steps — save files as they get written, then correlate file executions with one of the files that were saved.
For the first step, we could have hooked to the write system call. This approach, however, suffers from a number of drawbacks:
- Several system calls can be used to write to a file (
write, pwrite, pwritev…), and we would need to trace them all. - A file descriptor is given as an argument to these system calls, which means that we will need to hold some state about the open fds in the system, including the file path given when the file was opened using the open(at) system call.
- Relative paths can be given to the open system call, in which case we will need to evaluate the real path.
- There can be several hard links to the same file, which may seem to be different files while they are not.
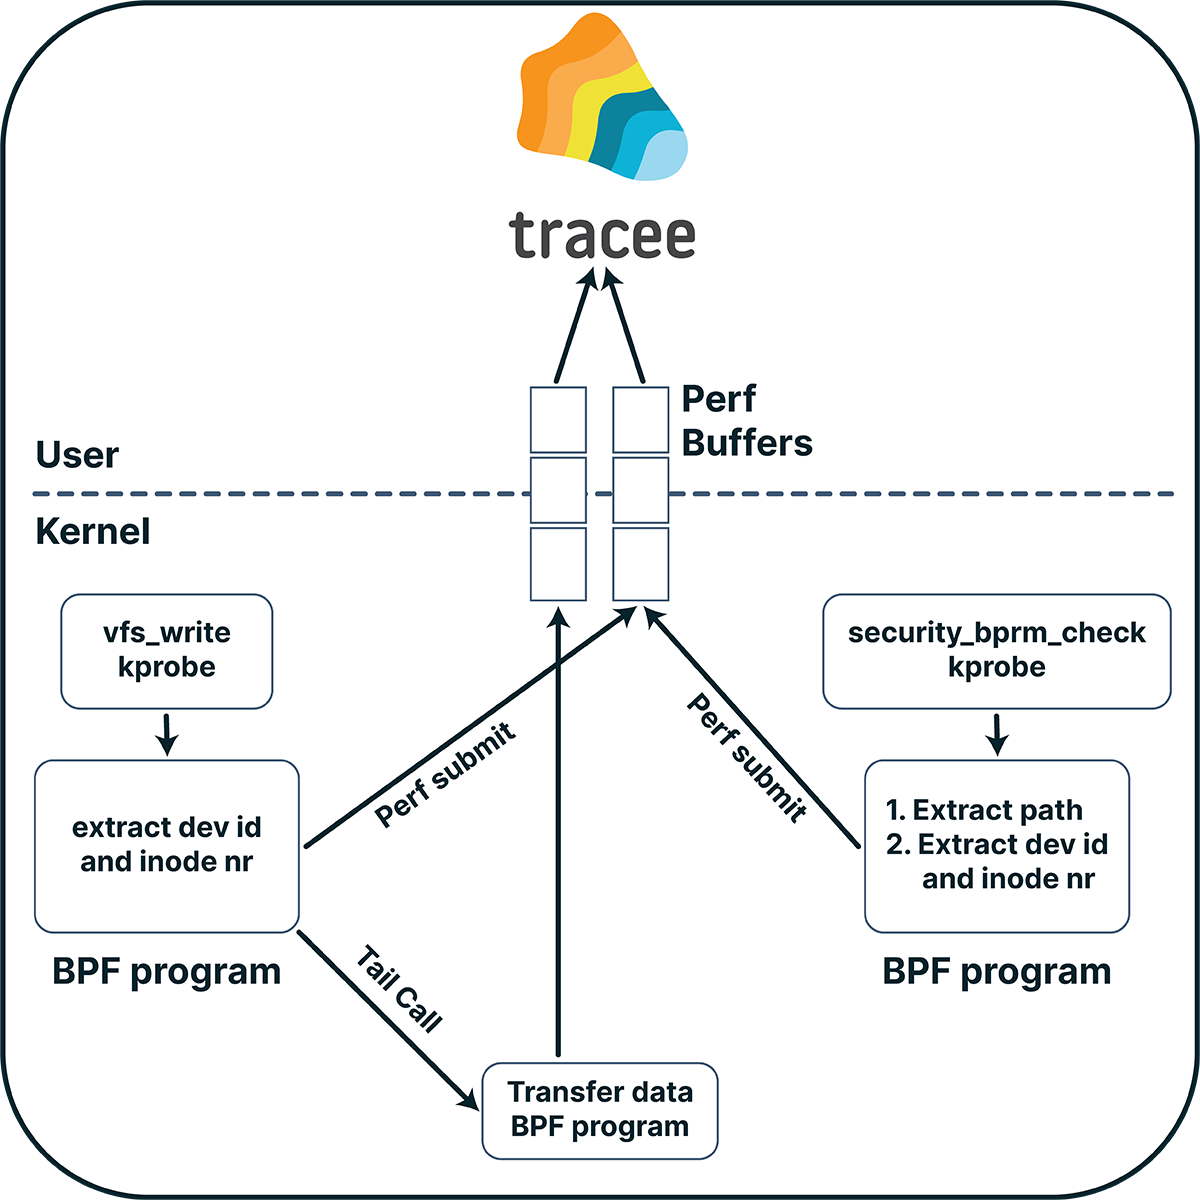
We need to find a better way to track file writes. Luckily for us, we can hook (almost) every function in the kernel using kprobes. A good candidate is “vfs_write”, and, as its name implies, VFS (Virtual File System) writes go through it. What’s interesting about this function, is that we work with the kernel file struct, and not with a file descriptor. Using this struct, we can get a lot of information about the file, such as its inode number and device id, which uniquely identify the file in the system. Moreover, we can get the absolute path of the file by parsing its f_path member. Using this path, we can then filter the events we are interested in, by comparing it to a given prefix. For example, in the case of files created with shm_open(), we can give “/dev/shm” as a prefix and for files created with memfd_create() we can give the prefix “memfd:” (as there is no real path on the filesystem for this kind of files, the kernel gives this prefix to them).
Correlating the captured files with exec calls
To capture binaries that were executed from memory, we still must correlate the files we saved with file executions. To do this, we can use the inode number and device id we got when we saved the files. But how can we get the inode number and device id of executed files? Tracing execve won’t give us this data, and it suffers from the same problems as the write system call we mentioned before. The solution is to use security_bprm_check, and to work with file struct as we did with vfs_write. Doing so, we can then match the inode number and device id of the files we saved with that given to the exec. If a match occurs, we know that the execution happened from memory, and we already have the payload of the executed file.

Figure 2: Correlating the captured files with exec calls
Capturing dynamic code executions
Many times, malware obfuscates its actions and avoids static scanning by dynamically loading code. To do this, the malware should write the code to be executed to some location in its address space. In order to execute code from that location, the memory region should have exec permission. Knowing this, we understand that if a process has a memory region that is both writable and executable, it probably dynamically loads code into it. However, this is not the only case. If a memory region that previously wasn’t executable suddenly becomes executable, we can say with high probability the same thing about it.
Dynamic Unpacker
Now, as the malware will try to stay stealthy, it probably won’t keep write+execute permissions for a memory region, as this can easily be detected by looking at the process memory maps (under /proc/pid/maps). We can use this fact to our advantage. If we can identify a memory region that was previously writable, and now write permission is removed and the region is executable – we know that this region contains code that was dynamically loaded. We can then copy this memory region and get the executable payload by using the same mechanism we described before for transferring big amounts of data to user space. Using this technique, we can automatically unpack payloads which were packed by common packers (e.g., upx).
As the extracted data is only the text (executable) section of the payload, we can’t execute it directly. However, this payload can be further analyzed, for example by performing a scan or reverse-engineering it.
Conclusions
With these two new capabilities for capturing file writes and dynamic code executions, Tracee has now grown into a powerful open source tool for performing forensic investigations and dynamic analysis of binaries. Capturing file write in the system, you can save the data to a given output path. Capturing dynamic code execution can detect malicious activity, even if it was hidden. You can use Tracee to uncover stealthy malware payload executions automatically, and quickly gain insights to help with remediation.


